Friday 7 December 2012

EXAMPLE OF INTERPRETING TOPO


Interpreting Toposheets


Hello,
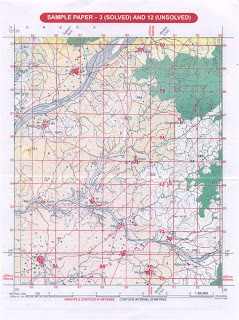
See the features of this toposheet. Divide the toposheet into 4 quarters. Study the each quarter. For example North west corner (A), North East Corner (B), South West Corner(c) and South East Corner (D). For example what features do you see in the A Corner???First of all, you see river Sipu, a few nucleated settlements, yellow wash, open scrub, little bit of green forest on top of A corner, we can see some spot heights too. Can you see a cart track (red line)? We can also see perennial wells (blue). Did you spot stony waste (8596)? In the same way, go through the B corner and C corner and D corner. Make a mental picture of the toposheet with prominent symbols. After having a quick glance of thetoposheet, read the questions that are asked. You have 15 minutes to read the question paper. First read the other questions and then come to the toposheet which requires more time to read. Keep a pencil ready to mark few features.For the bigger view of the toposheet, click on top of the picture.
  • Can you see R.F.? You can see at the bottom right. R.F. is 1:50,000. I have already explained to you how to write R.F. in the earlier lesson.
  • can you see the scale? You can see almost near the R.F. The scale is 2cm to 1 km. It means 2cm on the map is equal to the 1km on the ground. Good, i suppose u understood.
  • What's the contour interval of the toposheet? Check the contour interval near the scale. Contour interval of this toposheet is 20 metres.(usually it is 20 metres)
  • What else can you see? Ok, let's do the direction which i have explained to you earlier. Find out what is the directionof Rajkot lie from Gangudra? First of all, Rajkot is in grid square 8995 and gangudra is in grid square 8793. Imagine you are in Gangudra and you want to go to Rajkot from Gangudra? First of all, you hv to go up which is north and then you have to turn right, which is east direction.Therefore the comapass direction is north-east from Gangudra. Do you follow?
  • Where do you find the lowest part in the toposheet? The south west corner is the lowest part in the map. because two rivers flow towards south west whichis an indication of the slope. check the spot heights in the map. they are decreasing towards south west. Identify some spotheights in the map.
  • See the settlements on the map: What type of settlement do you find? Ofcourse, nuclear/compact/clustered. If you didnt understand, read the text book on settlements and come back to the blog.
  • What kind of rainfal this area gets? check the rivers-we can see broad sandy bed exposed, a thin water channel, (in blue) several cart tracks, and a pack track. This shows that the area gets seasonal rainfall.
  • Now let us see the occupation. Study the toposheet closely. I had told you about the occupations. Go through it again. Let us study the occupation of Bhadli (Jhat) - grid square 8596. What do you notice there? click the toposheet and check. its is A CORNER. There is a river, perennial wells (Blue dots), yellow patch(which means agriculture) and stony waste. Can you see them? From this we know that the occupation of the people of that area is cultivation and stone cutting or extraction of limestone. This is indicated by the presence of agricultural land ( in yellow colour), perennial wells and the presence of lime kilns.
  • It is a clustered settlement too.
  • Can you see the irrigation facilities or source of water? We can see the river which has narrow blue line which means it is perennial even though the river is seasonal. Then we also can see the perennial wells. So two perennial source of water is the River waters and well irrigation.
  • Let's study man made features - we can see few temples in the toposheets and permanent huts. I couldn't see any post office. As I have told you, my eyes are not very sharp. In the exam, they will ask one or two man-made features. So the man-made features are temples and permanent huts.
  • Now let's study the natural features - We can see rivers, trees, islands in the middle of the river, jungles, mines, pack tracks, cart tracks, lined wells, etc. You can see all these in this map. So, you select any two. The natural feature is river and forest. Sometime they will give a grid square and ask to you to mention one man-made feature and one natural feature. Go and locate that grid square and follow the points that I have told you.
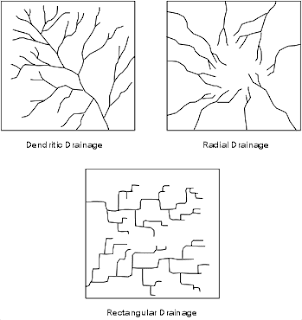
  • Let us see the drainage pattern on the map. See the area around the town Gangudra.(Grid square 8793) See the drainage pattern around the area-dont see only in the grid square 8793. Go beyond that. The river or drainage pattern is Rectangular or Trellised. Can you see the shape of the river? Thin lines that join the main river. Read the text book regarding the drainage pattern (if you have not understood) There are three drainage patterns - Dendritic(Tree like or veins of a leaf) Trellis/Rectangle and Radial.
  • Let us study the river bed of Sipu- In what two ways does the river bed of Sipu convey that it flows through a region of seasonal rainfall? We did go through that earlier. Study the river. It has a broad sandy riverbed which is exposed. If you dont understand the sandy river bed, go to the text book and looks for the symbos of sandy bed. You will see it in my blog too. It also has a thin water channel in the middle of the river. We also see many cart and pack tracks passing the river. Therefore, the river doesn't have much water in the summer season and so the river dries up. Do you follow me? Since the river is dry, you see the sandy beds and cart and pack tracks passing the river. So the people can cross the river during summer. Therefore it is a seasonal river.(it means the river gets water only in the rainy season).
  • What are the conventional sighs near north east part of the toposheet near open mixed jungle? - check corner B - We find broken ground there. So what is broken land? Broken land gives rise to Bad land topography. These are generally found along the banks of a river. Broken ground is caused due to erosion during rain when the river is in flood. It usually heappens in the area where there is no vegetation/plants.
  • Some time a question comes on the comparision of two settlements. Now let us study the village Jigol (grid square 8590) and other villages. Jigol is better off than other settlements. It has good transport system in comparision with other villages. We can see many cart tracks leading into the village. Plus it has many lined wells for irrigation purposes.
  • In which quarter of the map extract do you find the lowest area to be? Divide the whole toposheet into 4 corners. We have done that in the beginning. Look for the spot heights in the toposheet. if you study the heights, you will find south west qurater of the map are decreasing towards the south west. See also the river flowing. They flow towards the south west. So the south-west corner of the map exatract is the lowest region.
  • Hope you know how to find grid squares - 4 figure or 6 figure/digit grid reference. Find four digit grid square is easy but the problem begins when you have to find 6-digit grid reference. When you are asked to locate the 6-digit reference, rememeber these points. First find the square. Ok, let us locate a place using 6-figure grid reference of a temple in the north east of Odhava. Ok, let us see the 4-figure grid reference. It is in the grid square 8992. This is four figure grid reference. now we need 6-figure grid reference. After locating 4-figure grid reference, divide that square into 4 equal parts. First take a ruler and place it on the horizontal line of that grid square(. get the mid point. Then place the ruler on the vertical line and find the mid point and join these mid points. then u get the mid point of easting and northings. then u locate the spot in the grid square and if the spot is beoynd the mid point, then it wil be above 5. You can find the exact 6 figure grid reference by dividing grid squares into 10 blocks. Hold the scale vertical and horizontal on that grid square and join them. Now u get 10 X 10 equal squares. NOw you see where is the spot and give the grid reference.894925

QUESTION BASED ON TOPO MAP


Some Common Questions Based On Toposheets

If you get these questions, look for these points in the toposheets and can write these answers:

1.Mention ay two features seen in the map extract which indicate the region has seasonal rainfall.Seasonal streams/ Broken ground/open scrub/seasonal tank/cart track motorable in dry season/narrow perennial channel in the dry bed of the river(after looking for these features, select any two features that you find on the topo sheet and write this way)

Ans: Open scrub and seasonal streams are two features in the map that indicate the region has seasonal rainfall. 
Rivers, steams and ponds/tanks are dry in nature.
Barren land shown in white colour also indicate tht the region has seasonal rainfall.
2.Mention any three features seen in the map extract which attract holiday makers.(look for various tourist destinations like temple, water falls, lakes, park, sunset points, etc and then write answers)

3. Which is the chief form of irrigation shown in the map extract? Give somE evidences to justify your answer.(look for perennial wells first, then the rivers, lakes, tanks, etc and give answer. For example, if you find the presence of many blue circles in the map, then you can write your answer this way.)
Ans: The chief form of irrigation is perennial well-irrigation. Presence of blue circles scattered all over the map .

4. Give one reason to explain why the steams in grid square ......... do not join a river.
(look for sandy soil , rainfall, etc)Ans; Reasons for streams not meeting the main river due to:-
* presence of sandy soil which is porous
* poor rainfall
* high rate of evaporation. (any two ) 

5. State two reasons for the absence of human habitation in some region of the map extract.( check for any features that is not suitable for human habitation – like dense forest, open shrubs, steep hills, deserts, lack of roads, etc)Ans: The region is densely forested, many streams with very steep hills. Expensive to build roads. 


6. What is the small white patch in the river?Ans: Barren island 


7. What will be the main occupation of the people be in i. highlands ii. Lowlands?i. highlands – collection of forest products
ii. Lowlands - agriculture


8. Why are there no metalled roads in the mapped area?( reasons may be many- look for dense jungles, or barren land, steep hills, or many streams – and then answer according to the features,)Ans: The area has dense jungles, steep hills and no important settlement- steams and barren land discourage the building of metalled roads.


9. Give evidence to prove poor rainfall in the region.

(look for features like sand dunes disappearing steams, scrub vegetation, broken grounds, etc. If you find these features, then you write the answer this way)Ans. The region has poor rainfall due to the
•Presence of sand dunes
•Presence of undefined and disappearing streams
•Presence of scrub vegetation
•Presence of broken grounds 

10. Give two reasons for the presence of only footpaths in the green wash.The reasons for the presence of foot-paths are:
* seep and rugged terrain makes construction of roads difficult.
* temples are the only destinations in the forested mountain region and hence foot-paths are created by the pilgrims.
* footpaths may be created by people who depend on forest produce. 


11. Why do so many contour lines so close together in the extract indicate about the topography?(look for steep hills, or a temple in the jungle and if u find these.................)Ans: Very steep (indicated by close contours) and hilly (indicated by many contours) land. 


12. How can we draw a climatic inference from a toposheet?

(there may be a question - what type of climate do you find in the particular area - look for these features and then write the answers accordingly -First of all, we should try to know which area of the toposheet belongs to. This gives us a faint idea about the part of the country and the type of climate prevailing there. Further, scanty amount of rainfall can be judged by seeing dry rivers, dry tanks, sand dunes and scrubs and scanty vegetation. Similarly dense forests indicate tropical monsoon climate.)

(If you find dry rivers, or dry tanks or sannd dunes, scrubs, scanty vegetation, then your answer wil be)

The area experiences scanty rainfall or poor rainfall with dry weather.

(if you find dense forests, then your answer will be)

The area experinces Tropical Monsoon climate.


Questions on occupation

13. What is the occupation of the people of a particular region from an extract of the survey map or toposheet?

(When you get a question on the occupation of the people , look for these features. Directly from a toposheet, we cannot know about the occupation of the residents. We can amplify the occupation by inferences provided on the toposheet. Therefore one must know the colours and what it indicates. For example, all of you know that yellow colour indicates agricultural land and hence agriculutre can be major occupation. Green colour shows forested or wooded area and this indicates that people follow in lumbering, furniture making, carpentry and bamboo work, etc. Presence of big towns, industrial area, railway station, etc., indicates that people must be employed in urban services. Rest houses in hilly areas show devp of tourism. symbols of mines, may suggest that some people are employed in mining activities. if you find grassy area, then it indicates sheep or cattle rearing. Settlement along roadside indicates devp of trade and commerce. If you locate wells, tanks, canals, etc., show the cultivation of cash or cereal crops. parks, lawns, historical monuments indicate occupations like tourism, recreation, cultural devp, etc. So, my dear students, when you get a question on the occupation of the people, look for these features and write the answer accordingly. for example if you find grassy area or open shrubs, then the occupation will be sheep and cattle rearing. I hope you got me. )


14. What occupations do the people follow in Highland areas?
Ans: High land regions with steep slopes have the following features: 


  • most of the slopes are unsuitable for agriculture. Pastures on the slopes may be fit for grazing.
  • forestry may be a predominant economic activity in this region.
  • flat area over plateaus may be used for cultivation.

15. How can you judge the suitablity of land for agriculture from toposheets? give a good reason.

  • a meandering river on the toposheet will indicate a lower or nil gradient. Thus, such a plain area would be suitable for cultivation.
  • Dendritic or tree-like drainage pattern would confirm soft surface suitable for agriculure wheras trellised drainage pattern suggests chalk country, which is not much suited for cultivation.
  • Sand features, e.g. barkhans and disappearing streams would indicate the dry conditions with the high temperature. These conditions are unsuitable for agriculture.
  • presence of broken ground would confirm seasonal flooding. Silt deposition by rivers is a good sign for agriculture.
  • network of canals, dams, tanks and tubewells will indicate intensive use of land for agriculture.
  • so look for these features on the toposheet and write accordingly.

For example, which are the main occupations of the people in this area? give reasons in support of your answer.

( if you see yellow wash, perennial wells, green colour,kilns on the toposheet, your answer will be like this.)

Ans: Farming and forestry seem to be the two occupations in this area because a large part of the map has yellow wash which symbolizes cultivated area. A large number of perennial wells present in the area also support this inference. Some part of the map shows presence of open jungles.......(mention, south, or north, west or east) which is indicated by green colur which suggests forestry as an important occupation there. presence of kilns shows that lime and brick making is also an occpation of some people.


POINTS TO REMEMEBR REGARDING OCCUPATIONS:

  • If you find KILN , then the occupation will be drying and baking bricks, pottery, limestone, etc. So you write the answer this way: The occupation is drying and baking bricks, pottery, etc due to the presence of Kiln in the area.
  • if you find STONE QUARRY, then the occupation is quarring.
  • If you find irrigation from wells, canals or tanks, farming is the occupation.
  • if you find yellow wash, agriculture is the occupation of the area.
  • if you dont find any source of irrigation, it means farming is likely to be dependent on rainfall only.
  • mining is the occupation if you find settlements near mines or quarries.
  • if you find settlements along the banks of the river, then fishing is an occupation of that area.
  • if settlement is near the forest(green colour), then the people are dependent on forest products like fruits, nuts, or leaves. there may be primitive agriculture. so when you write the answer, write this way: people are dependent on forest produce or foresty and may practice primitive agriculure.
  • if you find large settlements, esp near the metalled roads, the occupation can also be industries, trade, services.
  • in case they are headquarters of districts, taluqs, employment can also be in administrative sector because of the presence of large number of offices and organisations.

so please go through the toposheet properly since one question will be definite on occupation.


16. What is the brown line in grid square ............. called? What does the figure written aong this line indicate?
(if it is a brown line , then it is a contour. Second part of the question - imagine you see figure 280 m ... then it means 280 m above sea level.)
Ans: The brown line that we find in grid square is Contour line. The line 280 m joins places 280 m above sea-level on the map.

17. What are the brown lines seen in such abundance? What do they indicate?
(same answer as question 16)
ans: They are contour lines. They indicate lines joining places having the same height above sea-level. Closeness of the contours indicates mountainous topography.

17. What is a causeway? Why are there so many causeways in the map?
Ans: Causeways are land raised across streams for use as metalled road or paths. The numerous streams crossing the metalled road are likely to flood them. 

18. Explain the term Depression in the map.

Ans: Depression is a shallow lowland in a sandy region often created by deflation of wind.

19. Name the geographical feature represented by white patches in the middle of the river.

Ans: The geographical feature in the middle of the river represented by white patches is an island or rocks or stores.

20. What do the following represent in the map? i. Black broken lines ii. Black curved lines.

i. Black broken lines indicate disappearing stream and black curved lines indicate broken ground.


21. Name 4 methods by which relief is shown on the map.
* Contour lines * Layer Colouring/tinting * Spot height * Hill shading.

22. What is layer-tinting/colouring?

It is a method, where a colour scheme is used to show relief on the map.


23. What is cartography?

Cartography is an art and science of drawing maps, diagrams and charts.


POINTS TO REMEMBER:


RELATIVE HEIGHT OR APPROXIMATE HEIGHT: REMEMBER:-This height is not taken from the sea level but with respect to the surrounding area. It may be height of a dam, bridge, sand dune, or it can be depth of a well, tank, hill, or river canal, for example 2r, 3r, 5r, 6r, etc.

Example:

3r the relative depth of the perennial lined well is 3 metres.(if 3r is written near the symbol of perennial well. don't write height but the depth)

5r the relative height of dry tank is 5 metres ( if 5r is written near the dry tank symbol)

16r therelative height of sand dune is 16 metres. (if 16r is written near the symbol of sand

dunes)

8r the relative height of river bank is 8 metres (if 8r is written near the river bank)

PLEASE NOTE: you must write the word RELATIVE HEIGHT/DEPTH of .................................


COLOURS:

7 COLOURS are used on toposheets:

i. BLACK: Names, lines of latitudes and longitudes, broken grounds, river banks, dry rivers, surveyed trees, heights and their numbering, railway mines, telephone, telepgraph lines

ii. RED: Grid lines (eastings and northings) , their numbering, roads, cart tracks, settlements, huts and other buildings.

iii. GREEN: Forested and wooded areas, scrubs, scattered trees, orchards

iv. BLUE: Water bodies containing water like wells, rivers, etc

v. YELLOW: cultivated areas

vi. BROWN: Contour lines, their numbering, form lines, all sand features like sand dunes, sand hills, stony waste

vii. WHITE PATCHES: uncultivated and barren lands


DIRECTIONS


Directions are important for physical as well as urban features. the physical features involve the directions of rivers, streams, and the urban cities from one another.

When a question is asked regarding the banks of the river or direction of the river, the following steps should be observed.

  • first of all, look at the spot heights to determine the slope of the land. As you know, spot heighs are marked this way ●265 ●289
  • see which spot heights are higher and where it is lower, and then you will know which way or direction it slopes. the slope of the land may be from north east to south west. and if you see a river , then it flows from north-east to south-west.
  • to know on which side or bank of the river a place is situated (a place may be a temple, settlement, town, etc)one has to locate the source of the river. Having located the direction of the river, imagine yourself standing at the source of the river f acing the main river. to your right is right bank and to your left is left bank. SO SIMPLE, BOSS!!!

when a question is askend on directions with reference to urban cites/settlements, remember these points.

  • some times the questions are asked on the direction of a city or settlement with a reference to the other. First of all, pay attention to the words 'FROM' a place and 'TO' a place. Imagine yourself standing on the 'FROM' PLACE and look at the TO PLACE. Use the direction arrow and write the direction.

FEW IMPORTANT TERMS:


A. Layer Tinting: Layer tinting is a method of showing relief by color. A different color is used for each band of elevation. Each shade of color, or band, represents a definite elevation range. A legend is printed on the map margin to indicate the elevation range represented by each color. However, this method does not allow the map user to determine the exact elevation of a specific point—only the range.

b. Form Lines. Form lines are not measured from any datum plane. Form lines have no standard elevation and give only a general idea of relief. Form lines are represented on a map as dashed lines and are never labeled with representative elevations.


c. Shaded Relief. Relief shading indicates relief by a shadow effect achieved by tone and color that results in the darkening of one side of terrain features, such as hills and ridges. The darker the shading, the steeper the slope. Shaded relief is sometimes used in conjunction with contour lines to emphasize these features.


d. Hachures. Hachures are short, broken lines used to show relief. Hachures are sometimes used with contour lines. They do not represent exact elevations, but are mainly used to show large, rocky outcrop areas. Hachures are used extensively on small-scale maps to show mountain ranges, plateaus, and mountain peaks.


e. Contour Lines. Contour lines are the most common method of showing relief and elevation on a standard topographic map. A contour line represents an imaginary line on the ground, above or below sea level. All points on the contour line are at the same elevation. The elevation represented by contour lines is the vertical distance above or below sea level.

(1) Index. Starting at zero elevation or mean sea level, every fifth contour line is a heavier line. These are known as index contour lines. Normally, each index contour line is numbered at some point. This number is the elevation of that line.
(2) Intermediate. The contour lines falling between the index contour lines are called intermediate contour lines. These lines are finer and do not have their elevations given. There are normally four intermediate contour lines between index contour lines.
(3) Supplementary. These contour lines resemble dashes. They show changes in elevation of at least one-half the contour interval. These lines are normally found where there is very little change in elevation, such as on fairly level terrain.

DIRECTIONS IN TOPO


DIRECTIONS

•Directions- important tool while reading topo map.
•Directions are important for physical as well as urban features.
•Physical features- directions of rivers, streams,
•Urban cities from one another


DIRECTION-TO RIVER AND RIVER BANKS

•Need to know which direction river flows.
•REMEMBER THESE STEPS:
1.First look at the spot heights to determine the slope of the land
2.To know which side/bank of the river a place is situated, one has to locate the source of the river. Having located the direction of the river, imagine yourself standing at the source of the river facing the main river facing the main river. Now to your right is right bank and to your left is the left bank.


Calculation of Area


Area= Length x Breadth
•In topo maps, each grid (square) 2cm X 2cm or 1 km to 1 km as per the scale 2 cm=1 km
•Therefore , area of each square is
4 sq cm (on the map)= 1 sq km (on the ground)
In metres, this can be expressed as
Area of each square (i.e. 4 sq cm) = 1000 X 1000
or 1,000,000 sq m.


To calculate the area by grid square method:


If there are some incomplete squares, area can be calcualted as follows:
-Note the number of completed squares
-Squares covered half are taken as ½
-Squares covering less than half area are taken as 1/3
-Squares covering more than half of the area are taken as 2/3
-All these estimated squares are added together and the sum is multiplied by the scale of the area given out above to obtain the desired area.


LAND USE


•IN topomap location of veg is closely related to relief.
•In the highlands, vegetation is shown –green colour along with contours in brown showing elevation.
•To show density of wooded area, different terms used:
•Dense forest, open-mixed forest, open jungle, fairly-mixed jungle, dense-mixed jungle, mixed jungle, Reserved Forest (RF), Protected Forest (PF), fairly mixed jungle with bamboo, dense mixed jungle with bamboo.
•The exterior boundaries of areas of Reserved or Protected forest are shown by green ribands .


THE PLAINS:-•Plains-mainly agriculture- cultivable land is shown in yellow colour
•White patch in plain shows bad land or rocky, uncultivable land.
•In such land, following features are found-
•Open scrub – scrub land where mostly sheep and goat rearing is practiced
•Stony waste – the land which is mostly covered with rock boulders and stones and cultivation is not possible.


SHEET ROCKS:-•Sheet rocks – a region mostly covered with a sheet of rock.
•Rock outcrop – In such region subsoil is exposed and cultivation is not possible.
•Broken ground – developed because of absence of natural vegetation on both the banks of the river. It is common in the desert area and in the areas of gully erosion.This is formed due to floods which occur during rainy season. Because of floods, the top soil is washed away developing into bad land which has loose soil and is uncultivable.


LOW LANDS:-
•Plains which are situated at lower level are mostly characterized by a meandering river.
•A disappearing stream shows a desert or limestone area
•Presence of canal, wells, tube wells and tanks indicate use of land for agriculture by means of irrigation
•A meandering river shows a flat area
•Perennial lined wells indicate a higher water table and are shown by blue dots.


•Presence of dry streams, dry ponds, exposed river beds and broken land shown in black indicate an area with scanty rainfall or seasonal rainfall or a desert region.
•Settlements are generally found on either side of river-wherever irrigation by canals or perennial lined wells is available


MEANS OF IRRIGATION

•Irrigation largely depends on relief and land use pattern of area (blue)
•Hilly region- no cultivation is possible, hence there is no need for irrigation
•On the flat lands which are coloured yellow, one can see blue, round spots which represent perennial lined wells. – therefore one can say that the main source of irrigation in such areas are wells and the occupation of people is farming.
•Other means of irrigation are canals, ponds, artifical lakes withj embankments and river in case it is perennial.
•Presence of dry streams and dry ponds with uncultivable lands shown in white indicates that the rainfall in the area is scanty.
•Presence of artificial man-made lake with embankment shows that water is being stored in off season and is used for irrigation through canals.
OCCUPATIONS

•Occupations have to be inferred from toposheets as there are no symbols to show the occupations of people.
•Sometimes, certain names like ‘farms’, ‘orchards’ provide some evidence of these occupations.
•The following list gives you some information about occupation of the people from a topo-sheet.

OCCUPATIONS EVIDENCES
Forestry, lumbering Forest or Green Patch
Agriculture Yellow Patch or orchards with many wells
Cattle-grazing or sheep rearing Meadows or Scrub, grasslands, meadows, pastures
Quarrying and mining Mines and Quarries, lime stone beds
Trade Settlement near main roads, ports, rivers, etc – dense
settlement
Entertainment & Cultural devpmnt Gold Courses, Parks, Rifle Ranges, etc
Industry Factory, mines, large settlements near roads and
railways, presence of raw materials (lime making and
cement industry near limestone beds)
Fishery Coast,l akes, rivers, etc
Tourism Hotels and Inns

•Thus, the occupation of the people of an area can be inferred from the following :
•Topography of land
•Size of settlement
•Presence of quarry and mines
•Communication network indicating trade

REMEMEMBER FEW POINTS:
HACHURING: Hachuring are short lines representing directions of a slope. For steep slopes they are drawn closer together than for the gentle slopes. However on flat ground, they cannot be used.
SPOT HEIGHTS: Spot heights are used to provide more information about land surfaces between the contours. These are represented by a number preceded by a dot. for example ●340

TRIANGULATION POINTS: When the spot heights are accurately surveyed, the dot is enclosed within a triangle and are called the triangulation points.

BENCH MARKS: The marks inscribed stones or shown on buildings to indicate the exact height determined through the surveys, are called the Bench Marks. These marks are shown by letters BM along with height . eg. BM 590
INDEX CONTOURS: To make the maps easier to read, contour lines are thickened at regular intervals. These thickened contour lines are called index contours.
FORM LINES: These are broken lines between contour lines to indicate minor details. They show approximate heights above sea level as they are used to indicate the elevations of the area which are not accessible for proper suvey.Hence they are drawn as broken lines and are called 'form lines'.
TRIGONOMETRICAL STATIONS: These points show height and are marked by a triangle and height. eg.∆ 877

SOME IMPORTANT QUESTIONS

1. What do you understand by R.F.?
R.F. stands for representative fraction. It is a ratio between the distance on a map and the actual distance on the ground. On this map the R.F. is 1:50,000 which means that 1 cm on the map represents 500 m on the ground, or, 1 cm on the ground represents 0.5 km on the ground.

2. What is Contour Interval?

Contour Interval is the difference in height between two consecutive contour lines. In the survey sheet of India, the contour interval is 20 metres.

3. What are contours?nState their properties.

The imaginary lines which are drawn on a map to joining places having the same height above the sea level.

Properties of the contours are as follows:

* contour lines join all places of the same height above sea level.

* distant contour lines indicate gentle slopes.

* closely spaced contour lines indicate steepy slopes.

* uniformly spaced contour lines indicate a uniform slope.

* contour intervals also differ according to the scale of themap.

* contour lines generally do not intersect each other on the map. However in some places they intersect , where it indicates a steeper cliff or a waterfall.
4. What is Grid? Give the importance of National Grid?
An imaginary network of equidstanct lines printed on map. It enables in locating the position of a place to be accurately defined in a simple way than by using latitudes and longitudes. National Grid is a co-ordinate used for map reference by ordinance survey.
5. What do you understand by 'scale' of a map?
A scale is a ratio of distance between any two points on a map to the corresponding distance between the same two points on the actual ground.
6. What is statement of scale?
It expresses the relationship of map to ground in words, such as one centimeter to five kilometres. It is expressed as 1 cm : 5 km.
7. What are cardinal points?
The four main directions of North, South, East and West are known as cardinal points.
8. What is 'causeway'?
It is a raised metalled road across a minor stream or low lying marshy area at a shallow point.
9. What is Grid square?
It is an area of 1 sq km demarcated on the toposheet by the intersection of Grid line. Each Grid square measures 2 sq cm distance of map.
10. What is meant by the term Fire Line? Account for the necessity of Fire Lines in the jungle area of the given map extract.
'Fire Line' means a clearing or a gap or an empty space that runs through a forest area. It is often also a trench which is filled with water or sand. This is done to stop the spread of fire in the forest.
11. What advantage does a Representative Fraction have over a verbal scale?
It has universal application as it does not use any unit.
12. what do the figures 1:50,000 printed on the map extract mean?
The figures 1:50,000 mean that one cm on the map represents 50,000 cm on the ground i.e. 1 unit on the map is equal to 50,000 units on the ground. It also means Representative Fraction.
13. What is the meaning of the conventional sign given on the map?
PTO - It means Post and Telegraph Office.
14. What does the brown line in toposheet indicate?
The brown line in the grid squre ______ is the indication of a contour line.
15. Explain why there are so many causeways along the metalled road.
There are many causeways along the metalled road because of seasonal streams/dry streams.
16. On the map, what does the following indicate: i. Green wash ii. yellow wash
The green colur indicates that it is fit for forestry/open mixed jungle and the yellow colour indicates that the land is fit for agriculture/cultivation/farming.
17. Name the geographical feature represnted by white patches in the middle of a particular river.
The geographical feature represented by the white patches in the middle of the river is an island and rocks/accumulation of pebbles.
18What does 3 r written in the tank in grid square indicate?
It indicates the relative height of the tank which is 3 m above sea level.
19. What is the general land use of i. even ground ii uneven ground?
The general uses of even ground are agriculture or cultivation or farming, for construction of canals, for laying of railway linesm markets and development of townships and the general uses of uneven ground are vegetation, forests, grazing, forestry, and mining.
20. What does the word brackish in the toposheet indicate?
It indicates the water of the lined well is salty or saline, not fit for agriculture and drinking.
21. What does the letters LY indicate?
it indicates a subdivision of a survey map indicating an area of 100 x 100 km.
22. Why do you hve the letters QC and QD side by side?
QC or QD indicate a subdivision of a survey map 100 x 100 km. Between QC and QD, Es are 00.

READING GRID REFERENCES


READING THE GRID REFERENCE

i)Origin is the South –West (SW) corner of the map. The reading on the map is always taken with reference to this origin.
ii)Eastings are always read to the East of the origin.
iii)Northings are always read to the North of the origin.
•It is also identified as the Grid Reference


i)The readings are always taken to the right of the Eastings and to the North of the Northings.
ii)While giving a grid reference, Eastings are always stated first, followed by Northings


Grid Reference of this picture is 2676


Four Figure Grid Reference:-•In four-figure grid reference, the first two figures are the eastings and the last two are the northings.
Six Figure Grid Reference:•For greater accuracy, a third figure may be added to two-figure eastings and northings.
i) Obtain the four figure reference by using first two digits of eastings and northings. 
ii)Then divide each kilometre into ten parts visually, both vertically & horizontally.
iii) Mark the division of eastings and the division of the northing corresponding to the location.
iv) The crossing point is the location of the reference point. 
SCALE
•Refer to Survey Map No. 45D/7
•In the map, 1:50,000 is the R.F. of the map, which means that one unit on the map represents 50,000 units on the ground.
•For example, 1 cm on the map represents 50,000 cm on the ground.
(Scale of this toposheet is)
Scale-2cm:1 km or1:50,000

R.F. or Representative Fraction is the ratio between the distance on the map and the corresponding distance on the ground in the same unit.•Therefore, R.F. 
Distance on the map
____________________________
Distance on the ground

In the above map, R.F. = 1:50,000
This map is referred to as 1:50,000map and its scale is 2 cm=1km. 


Representation of Relief on the Map and its Interpretation

Earth’s surface – uneven – made up of hills, plains, plateaus, lowland which are varying in their elevation or heights from sea level.
•The total terrain is also called physical landscape.
•It can be represented on the maps through different methods, such as spot heights, contouring, etc.
•Surveying is considered a part of science of map making.
•Topographical maps are large-scale maps, they show a great deal of details about the relief.
•In Topographical survey, actual survey is carried out and different methods are used to represent relief on the map as follows.
i)Hachuring
ii)Hill shading
iii)Form lines
iv)Spot heights
v)Triangulation points
vi)Bench markscontours

i)Hachuring: 
are short lines representing directions of a slope.
- For steep slopes , they are drawn closer together than for the gentle slopes.
- on flat grounds they can not be used at all.


DISADVANTAGE: it gives no indication of the actual height and that both high plateau region and low plain are unshaded
The close hachuring of the high mountain regions tends to obscure other details of the map.

II) HILL SHADING: 
A method of representing relief on a map by depicting the shadows that would be cast by high ground if light were shining from a certain direction.
It can be defined as the addition of shadows to give the optical illusion of a third dimension, making hills stand out in relief. The shadows can be regarded as those which would be cast on an imaginary relief model of the ground when illuminated by parallel rays of light from a selected direction or directions.
In this map, it is assumed to be from north west at an angle of 45 degree with the horizon.
This method too gives a general idea of relief of the country by it does not give the actual height and that it is difficult to know whether a piece of land is sloping uphill or downhill.

THE DRAINAGE
The term drainage basin describes an area drained collectively by the network of a river along with its tributaries and sub-tributaries of various dimensions.

•An area drained by a single river is called its Catchment Area.

•A drainage system as seen in the topographical sheets usually develops a pattern which is related to the general structure of its basin.

3 distinct patterns can be recognized 

1)Dendritic:


Dendritic drainage patterns are most common. They develop on a land surface where the underlying rock is of uniform resistance to erosion. 
•Dendritic drainage systems are the most common form of drainage system. The term dendritic comes from the 
Greekword "dendron", meaning tree, due to the resemblance of the system to a tree.
•In a dendritic system there is one main river (like the trunk of a tree), which was joined and formed by many smaller
tributary rivers. They develop where the river channel follows the slope of the terrain.
•Dendritic systems form in 
V-shaped valleys; as a result, the rock types must be impervious and non-porous

2. TRELLIS 


Rectangular drainage patterns develop where linear zones of weakness, such as joints or faults cause the streams to cut down along the weak areas in the rock.

•Trellis systems form in areas of alternating geology, particularly chalk and clay. The main river (the consequent) flows straight down hill.
•Subsequent streams develop perpendicular to the consequent along softer rock and erode it away, forming vales.
•The consequent river then cuts through the escarpments of harder rock.
•Obsequent streams flow down the
dip slope of the escarpments to join the subsequent streams. 


3. RADIAL


•Radial drainage patterns develop surrounding areas of high topography where elevation drops from a central high area to surrounding low areas.


SIGNIFICANCE OF COLOURS IN TOPOSHEETS
On toposheets colours are used to show certain features. Each colour used on a map has significance.
1. BLACK – All names, river banks, broken ground, dry streams, surveyed trees, heights and their numbering, railway lines, telephone and telegraph lines, lines of latitude and longitude.
2. BLUE – Water features or water bodies that contain water.
3. GREEN – All wooded and forested areas, orchards, scattered trees and scrubs.
Note:- Prominent surveyed trees are shown in black. Surveyed trees have numbers on their trunks. They serve as landmarks and are not allowed to be cut.
4. YELLOW – All cultivated areas are shown with a yellow wash.
5. WHITE PATCHES – Uncultivable land
6. BROWN – Contour lines, their numbering, form lines, and sand features such as sand hills and dunes.
7. RED – Grid lines (eastings and northhings) and their numbering, roads, cart tracks, settlements, huts and buildings.
SETTLEMENTS
1. On a topo map, all settlements are shown by symbols in RED colour.
2. The size of the symbol and size and style of letters used give an idea of the size of the settlement.
3. In the case of large cities, major roads are marked and named.
4. Deserted village cities, temporarily occupied huts are also shown.
5. Places of worship, forts, water towers, burial grounds, police stations, post office, dak bungalow, circuit houses, etc. are indicated by suitable symbols.
NOTE – Site is the land on which the settlement (village or town) is built.
Dense settlements : Fertile plains and wide river valleys.
· Sparse Settlements : forests, deserts, mountain slopes, plateaus and hill tops with poor vegetation·
Absence of Settlements: Swamps, marsh land, sandy deserts, thick impenetrable forests, flood-prone areas, steep mountain slopes.

OCCUPATION AND MAP FEATURES

AGRICULTURE – Level land with yellow wash; many wells

LUMBERING: Forests

CATTLE REARING – Pastures, meadows, grasslands, presence of road in highland region (sheep)

FISHING – Plenty of rivers

MINING –Stony wastes, quaries, limestone beds

TRADE – Dense settlements near road

INDUSTRY – Large settlements near roads and railways, presence of raw materials, (like making, cement industry near limestone beds)

TOURISM – hotels and inns

APPROXIMATE OR RELATIVE HEIGHT-is height is not taken from sea level but with respect to the surrounding area. It may be the height of a dam, bridge, sand dune or it can be the depth of a well, tank, hill or river canal, for example , 3r, 5r, 8r, etc.
EXAMPLE:3r - the relative depth of perennial lined well in 3 metres
●5r – the relative height of dry tank is 5 metres